What is Demand Mapping?
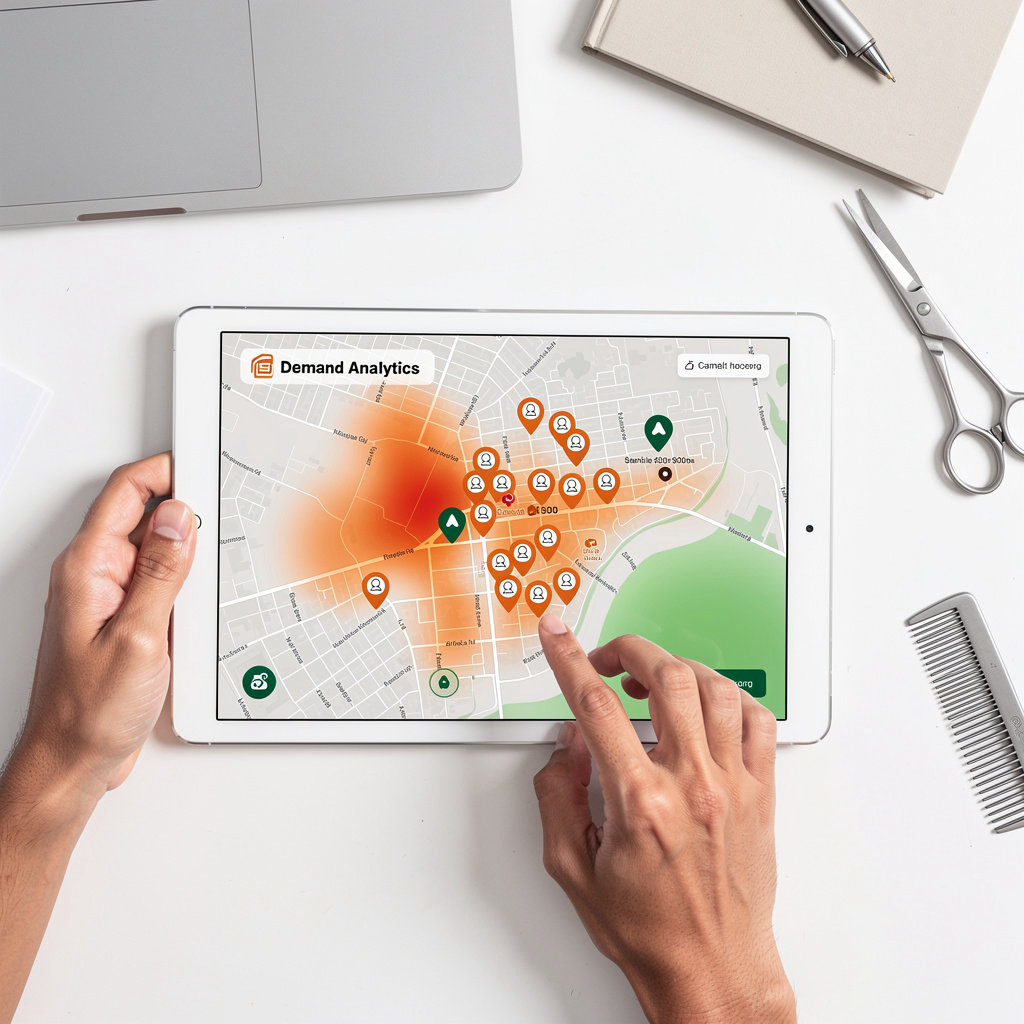
Demand mapping aggregates real customer requests—"I'm looking for a barber in [neighborhood]"—and visualizes them as pins and heatmaps on an interactive map. Instead of guessing where customers want your services, you see the actual demand signals in real time.
Data source: Real customer searches, requests, and service inquiries from across your market—not demographic guessing.
How It Works
Collect Requests
Customer requests are captured from across your market.
Geo-Tag & Plot
Each request is pinned to its exact neighborhood on an interactive map.
Generate Heatmaps
Heatmaps show demand density—red zones indicate high demand, green indicates lower demand.
What You'll See
- Individual request pins—see exactly where customers are asking for your services.
- Colored heatmap zones—red = high demand, green = lower demand at a glance.
- Request volume by neighborhood—compare demand across areas instantly.
Business Insight
High-demand zones with few competitors are prime expansion targets.
Real Example:
See 200+ customer requests in Neighborhood A (1 competitor) vs. 50 requests in Neighborhood B (5 competitors)—Neighborhood A is your expansion target.
Competitor Mapping: Identify White-Space Opportunities
See exactly where your competitors are—and more importantly, where they're not. Our competitor mapping reveals density zones, service gaps, and high-opportunity neighborhoods where you can expand with less direct competition.
What is Competitor Mapping?
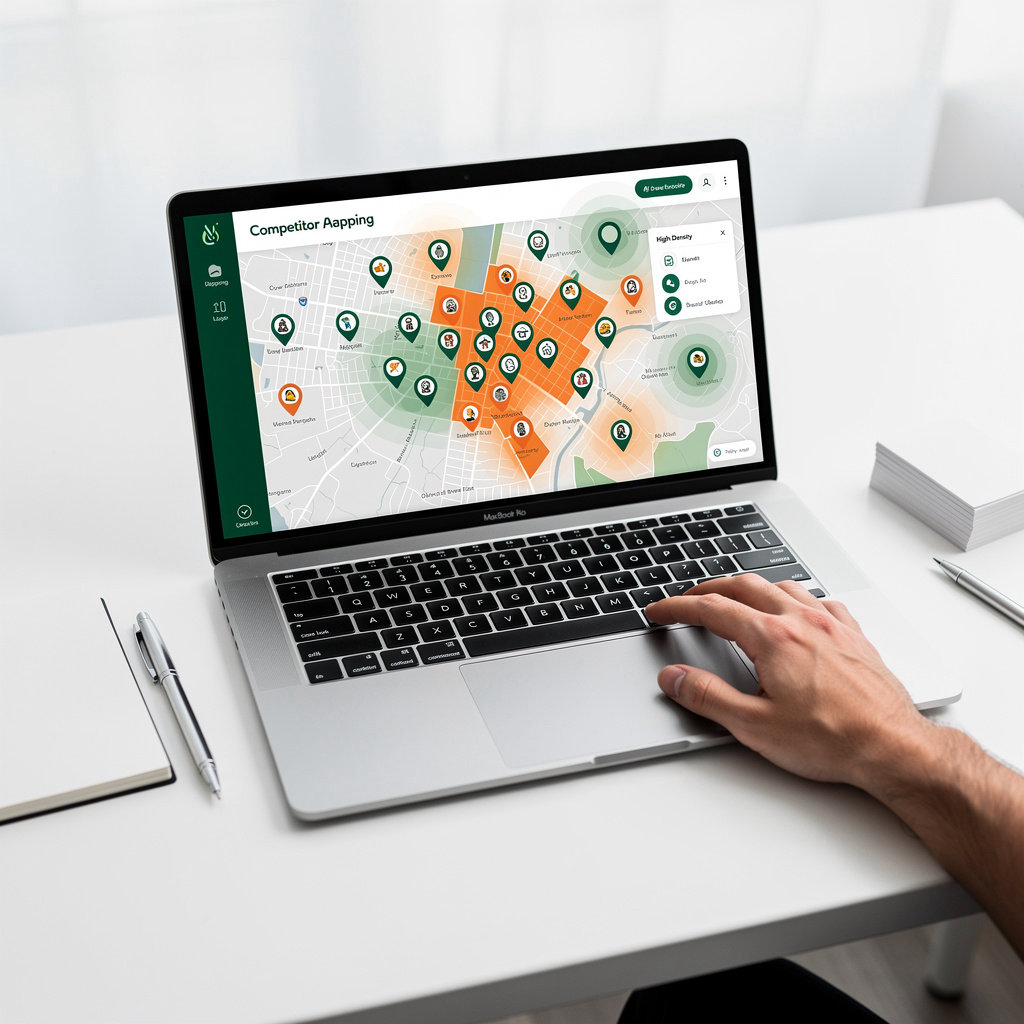
Competitor mapping overlays all competitors in your market on an interactive map, showing density, location, service offerings, and pricing. Instead of guessing where your competition is strongest, you see the complete competitive landscape at a glance.
How It Works
Our platform identifies all competitors in your market—salons, barbers, spas, and specialized beauty services—and categorizes them by type and service offerings. Each competitor is plotted on your map with verified data: location, services, pricing, and customer reviews. The result is a complete competitive intelligence dashboard.
What You'll See
- Competitor pins color-coded by type (salon, barber, spa, etc.)
- Density zones showing high-competition (red) vs. low-competition (green) neighborhoods
- Competitor count by neighborhood—see exactly how many salons compete in each area
- Service offerings for each competitor—understand what they offer and identify gaps
The Business Insight
White-space areas—neighborhoods with high customer demand but low competitor density—are your expansion goldmine. Our platform identifies these opportunities automatically, so you can expand into underserved markets where you'll face less direct competition and capture market share faster.
Example: Downtown has 12 salons (saturated market) vs. Eastside with only 1 salon but high customer demand. Eastside is your white-space opportunity.
Pricing Analytics: Optimize Revenue by Neighborhood
Understand what customers will actually pay in each neighborhood—not just city-wide averages. Our AI analyzes price sensitivity by location, revealing exactly how to maximize revenue in every area you serve.
What is Pricing Analytics?
Pricing analytics reveals neighborhood-level price sensitivity and optimal pricing strategies. Instead of charging the same price city-wide, you'll discover what each neighborhood's customers are willing to pay.
How It Works
Our platform aggregates competitor pricing, customer reviews mentioning price, service request patterns, and local income levels. The AI synthesizes this data to infer price sensitivity and recommend optimal pricing for each neighborhood.
What You'll See
Price sensitivity heatmaps (high price tolerance in green, low in red), recommended service packages by neighborhood, and revenue optimization suggestions. See exactly which areas support premium pricing and which need value packages.
Real-World Example: Downtown customers willing to pay $65 for haircuts; Eastside customers price-sensitive at $45. Adjust your packages accordingly to maximize revenue in each area—premium services downtown, value packages on the Eastside.
Key Benefits:
- Maximize revenue per neighborhood with data-backed pricing
- Avoid leaving money on the table or pricing yourself out of markets
- Create neighborhood-specific service packages that sell
- Stay competitive while protecting your margins

See Your Market Opportunity
Get a free demand map, competitor analysis, and pricing recommendations for your target neighborhood. No credit card required.
Your free analysis includes:
- A demand heatmap showing customer request density in your target area
- Competitor mapping revealing white-space opportunities
- Neighborhood-level pricing recommendations to maximize revenue
Takes just 60 seconds. Results delivered instantly.
Join hundreds of salon and barber owners making smarter expansion decisions