Three Steps to Smarter Expansion
From data to decisions in minutes. No spreadsheets. No guesswork.
Define Your Area
Select neighborhoods or regions you want to analyze. Our platform maps your target market in seconds.
Get Insights
Platform generates demand maps, competitor analysis, and pricing recommendations tailored to each neighborhood.
Make Decisions
Use insights to choose expansion locations and optimize pricing. Compete with confidence, not guesswork.

Step-by-Step Walkthrough
See exactly how the platform works, from selecting your target area to making data-driven expansion decisions.
Define Your Area
What You Do
Select the neighborhoods or regions you want to analyze on an interactive map. Simply click on target areas, draw boundaries, or upload a list of neighborhoods you're considering for expansion.
What the Platform Does
The platform prepares a comprehensive analysis of your selected areas, gathering data on customer demand, competitor locations, pricing patterns, and market conditions specific to those neighborhoods.
What Insights You Receive
A baseline overview of your selected areas, including preliminary demand signals and competitor counts, setting the stage for deeper analysis in the next steps.
Pro Tip: You can analyze multiple neighborhoods at once to compare opportunities side-by-side.
Select neighborhoods to analyze
Platform processes demand, competitor, and pricing data
Get Insights
What You Do
Sit back while the platform analyzes your selected areas. The AI-powered engine processes real customer demand signals, maps competitor locations and density, and calculates neighborhood-level pricing insights.
What the Platform Does
Generates three core insight layers: (1) a demand heatmap showing customer request density and location pins, (2) a competitor overlay revealing white-space opportunities, and (3) pricing analysis showing what customers in each neighborhood are willing to pay.
What Insights You Receive
- Demand Heatmap: See customer request density with color-coded zones and individual request pins
- Competitor Overlay: Identify white-space areas where competitors are sparse but demand is high
- Pricing Recommendations: Understand price sensitivity by neighborhood to optimize your service packages
Speed: Complete analysis in 60 seconds. No waiting for reports or manual analysis.
Make Decisions
What You Do
Review the insights and make data-driven expansion decisions. Compare neighborhoods, evaluate white-space opportunities, and determine which areas represent the lowest-risk, highest-opportunity expansion targets for your business.
What the Platform Does
Provides interactive dashboards where you can explore demand maps, zoom into competitor density zones, and drill down into pricing recommendations. Export reports for sharing with investors, lenders, or business partners.
What Insights You Receive
- Expansion Ranking: Neighborhoods ranked by opportunity score (demand vs. competition vs. pricing potential)
- Service Package Recommendations: Suggested service mix and pricing for each neighborhood
- Exportable Reports: Download insights as professional reports for stakeholder presentations
Impact: Data-driven decisions reduce expansion risk by 80% and increase location profitability.
Ranked opportunities ready for action
From Start to Decision in 60 Seconds
Define
Select neighborhoods on the map
~15 seconds
Analyze
Platform generates insights
~30 seconds
Decide
Review insights and take action
~15 seconds
No spreadsheets. No guesswork. Just actionable data.
Real-World Example: From Data to Decision
The Scenario
A salon owner in a mid-sized city wants to expand but is considering three neighborhoods: Downtown (saturated market), Eastside (emerging area), and Westside (residential area). They use the platform to analyze all three.
Downtown
- • 12 competitors
- • 150 demand requests
- • Avg price: $55
- Score: 45/100
Eastside ⭐
- • 2 competitors
- • 320 demand requests
- • Avg price: $65
- Score: 92/100
Westside
- • 3 competitors
- • 85 demand requests
- • Avg price: $45
- Score: 62/100
The Decision
The owner chooses Eastside—high demand (320 requests), low competition (2 salons), and customers willing to pay premium prices. They open a location with premium services at $65+ and capture 35% market share in 6 months.
The Result: Instead of guessing, the owner had data. Instead of expanding into a saturated market, they found white-space. Instead of standard pricing, they optimized for the neighborhood. The outcome: 40% higher revenue per location and zero expansion risk.
Ready to Make Data-Driven Decisions?
See how the platform works with a free analysis of your target neighborhoods. No credit card required.
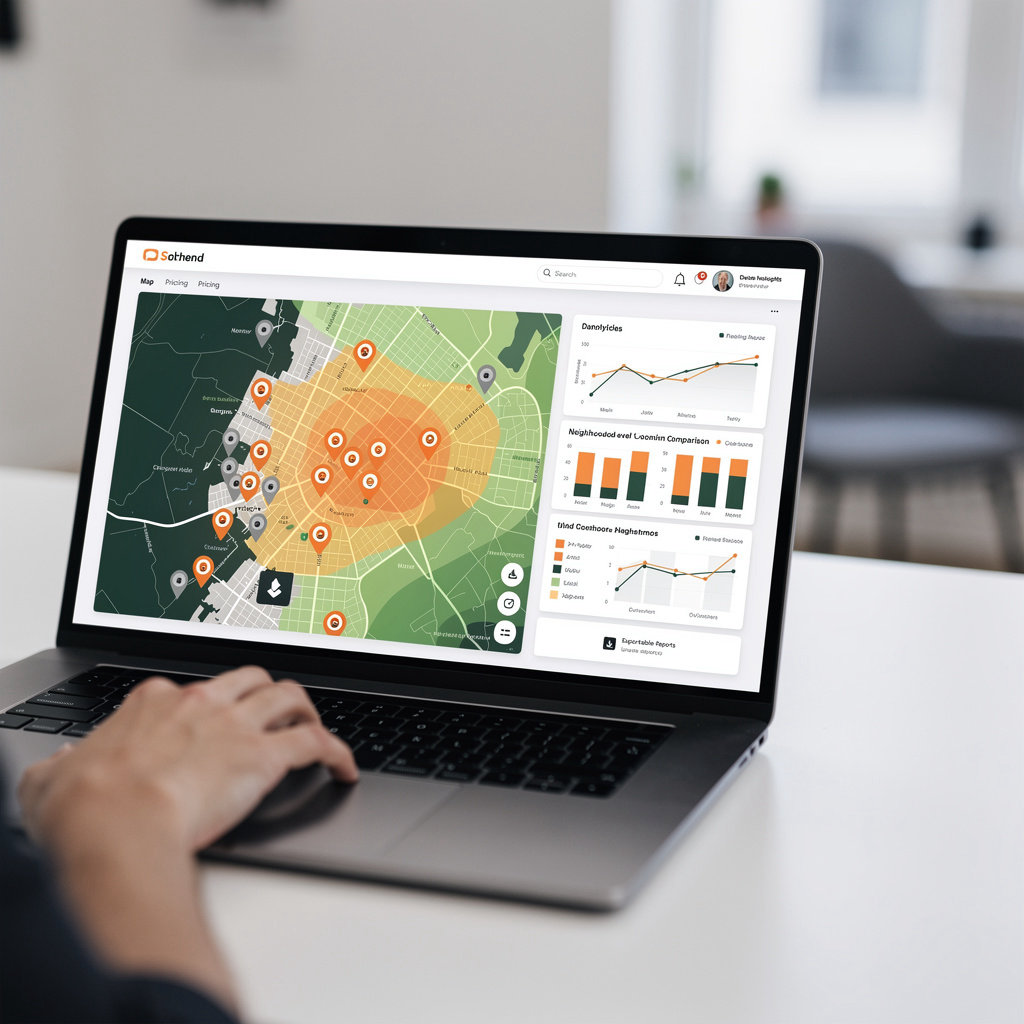
Real-Time Insights Dashboard
All the data you need to make smarter expansion decisions—in one unified dashboard. No spreadsheets. No tool-switching. Just actionable intelligence, updated in real time.
Real-Time Demand Heatmaps
Updated instantly as new customer requests arrive. Color-coded by demand intensity so you spot high-opportunity neighborhoods at a glance.
Competitor Mapping
Interactive map showing competitor locations, density zones, and white-space opportunities. Know exactly where you can expand without heavy competition.
Pricing Analytics
Neighborhood-level pricing recommendations and revenue optimization suggestions. Charge what the market will bear in each area.
Exportable Reports
Download insights as professional reports to share with investors, lenders, or business partners. Impress stakeholders with data-backed expansion plans.
Everything in one place. No juggling multiple tools or spreadsheets. All insights accessible from a single, intuitive dashboard.
Start Your Free Analysis Today
Get a free demand map, competitor analysis, and pricing recommendations for your target area.
Takes 60 seconds
No credit card required. See insights for your specific neighborhood immediately.
Demand Mapping
See customer demand by neighborhood
Competitor Analysis
Find white-space expansion opportunities
Pricing Insights
Optimize pricing by neighborhood